The real estate market is ever-changing. Much like all property markets, Dubai’s real estate has had changes over the last few years, from price fluctuations, oversupply, sales volumes, and more.
fäm’s Property Price Index is an interactive tool that breaks down and helps you understand the property price index of Dubai’s properties, whether land, unit and villa/building, and is not limited to just one area.
It provides insights such as property price change, property sales value, property sales volume and property price change in all Dubai in a specific area within a specific time frame as of March, comparing Q1 over the years.
Dubai Property Price Change (per Sq. ft.)
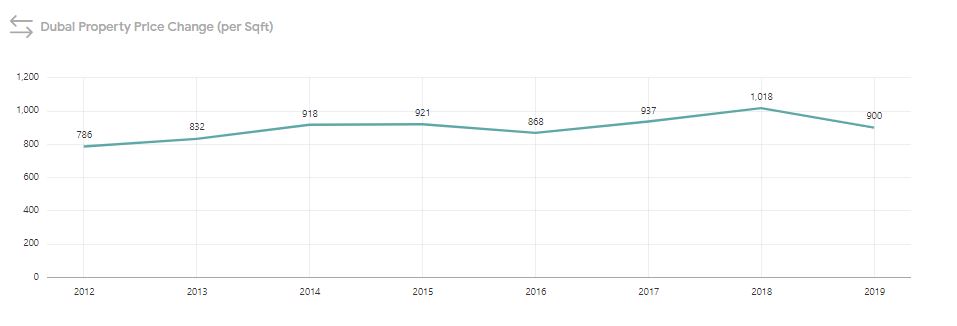
This chart shows the price change over the years for a specific time frame per square foot. So we are comparing Q1 over the years. Over the last few years, prices have fluctuated particularly in Q1 of 2012 when the property prices change per sq. ft. reached the lowest compared to the years ahead. The median price was 786 seven years ago, but then 2018 had the highest median price with a total of 1,018 and 8.6% year-on-year. As of the month of March, the median price is 900 and has recorded an average of -11.6% decrease in price in 2019 compared to 2018.
Let’s take an example of an area to help you understand more. In Downtown Dubai, we can see that the prices have increased sharply from Q1 2012 to Q1 2014 them somewhat steady till it saw a slight decrease in 2018, with an average media price of 1,770. In addition, it has been seen that the price increased to around 14% compared to 2018.
Dubai Property Sales Volume
The report provides insight on the overall property sales volume or the number of units sold within a reporting period in Dubai.
From 2012 to 2019, the year 2018 saw the highest number of properties sold, recording a transaction count of 18,639. Not only did 2012 have the lowest property price change per sq. ft., it also had the lowest transaction count compared to the last few years till today.
The year 2013 had a steady rise then in Q1 2014 saw an increase by a 1,185 transaction count. It was until 2017, the property sales volume reached the highest between 2012 and today, with a total of 18,639 and 63.4% year-on-year.
Dubai Property Sales Value
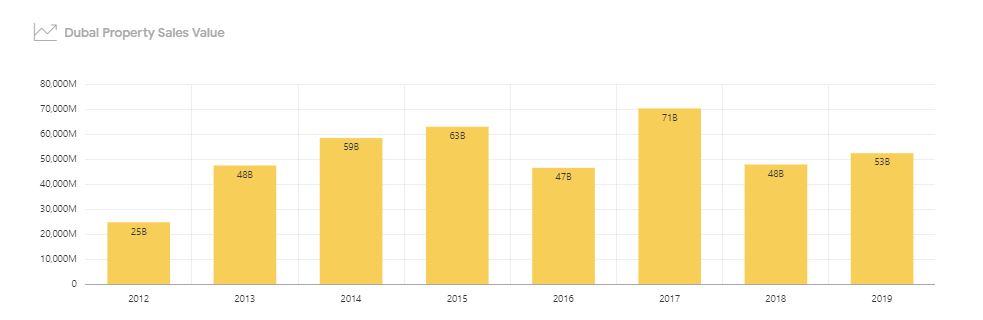
In addition to the property sales volume, fäm’s Property Price Index also shows the property sales value. Let’s take Arabian Ranches 1 as another example. In 2013, the premium gated community has seen the highest in sales value with AED 1.0 billion. Since then, there has been a decrease in sales value.
In the overall areas, the year 2013 recorded the highest in terms of sales value during Q1, totalling to AED 1.0 billion. It even showed that there has been a decrease in 18.9% compared to last year.
The Number of Launched Properties
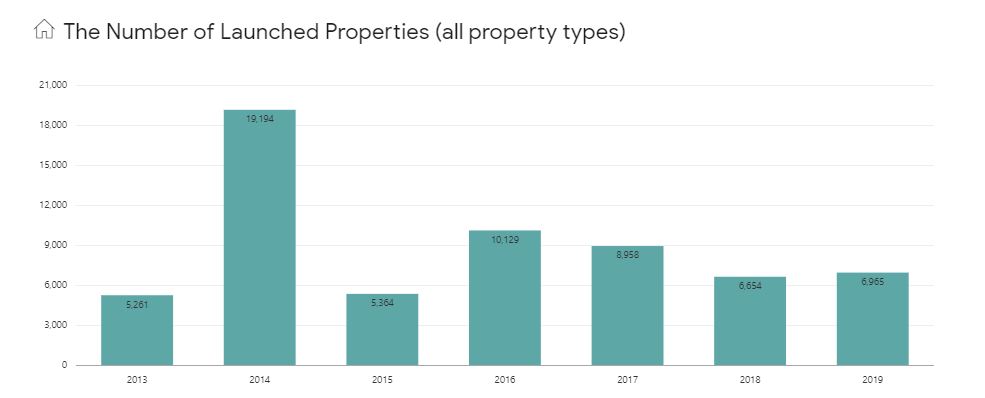
Dubai has a myriad of properties launched and delivered, but it was back in 2014 that saw the highest number of launched properties; 19,194 launched properties and 265% increase year-on-year.
For instance, in Business Bay, it had the most number of properties launched with 2,566 number of volumes three years ago.
The Number of Delivered Properties
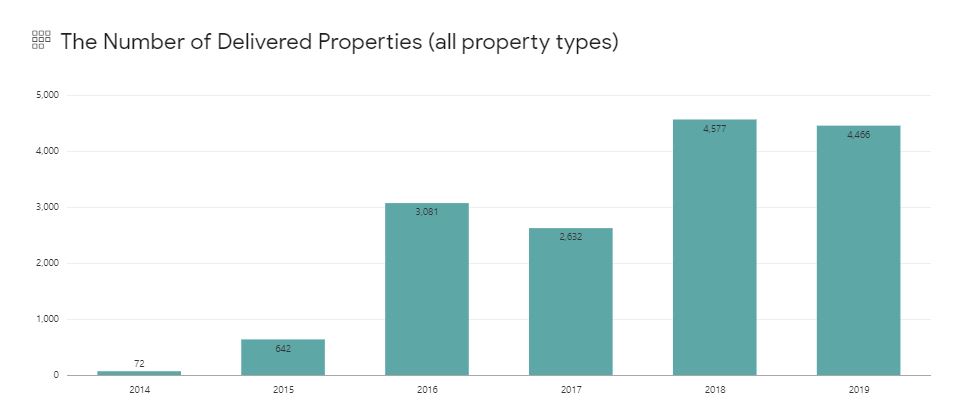
Although 2014 had the highest launched properties, the number of delivered properties was even lower the same year, recording 72 number of volumes.
The highest was last year, with 4,577 number of delivered properties but the number of launched properties was 6,654, less than in 2017.
Property Price Change per Area (per Sqft)
The report also includes property price change per area (per Sq.ft.) in all Dubai in 2019 vs 2018. At Barsha Heights, Al Thanya First had a positive change (429.2%) in price per sq. ft. in 2018 compared to 2019 in terms of land.
While as a unit type, there’s a -57.8 percentage decrease. In 2018, the price per sq. ft. was AED 2,722,79 while in 2019 it calculated an AED 1,149.23.
Property Transactions Volume per Area
Apart from property price change per area, there’s also property transactions volume per area.
With Barsha Heights as the same example, the transaction volume per area in 2018 compared to 2019 saw a positive percentage change as a type of land, equivalent to 600% change.
While as a unit, there’s a decrease in -30%.
Properties Construction Progress 2019
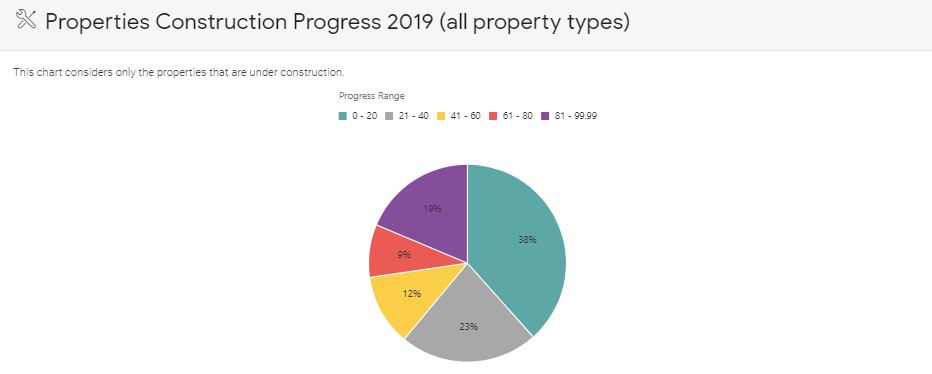
The majority of all properties around Dubai are under construction, totalling to 38% with a value of 61,479. While 18% of the properties is almost complete, with 29,562 number of properties to be ready.
Find out more on fäm’s Property Price Index here.