
When investors talk about predicting price trends, they often focus on transaction data or listing prices. But professional market watchers know that Days on Market (DOM) — the average time it takes to sell a property — is both a cooling warning signal and a heating confirmation signal. DOM works in both directions, making it one of the most versatile tools for anticipating market shifts.
DOM as a Two-Way Leading Indicator
DOM doesn’t just measure speed of sales — it reflects the balance of power between buyers and sellers:
-
DOM Falling: Market is heating up. Demand is strong, listings move faster, and prices tend to rise soon after.
-
DOM Rising: Market is cooling. Listings linger, buyers gain leverage, and prices tend to soften in the months that follow.
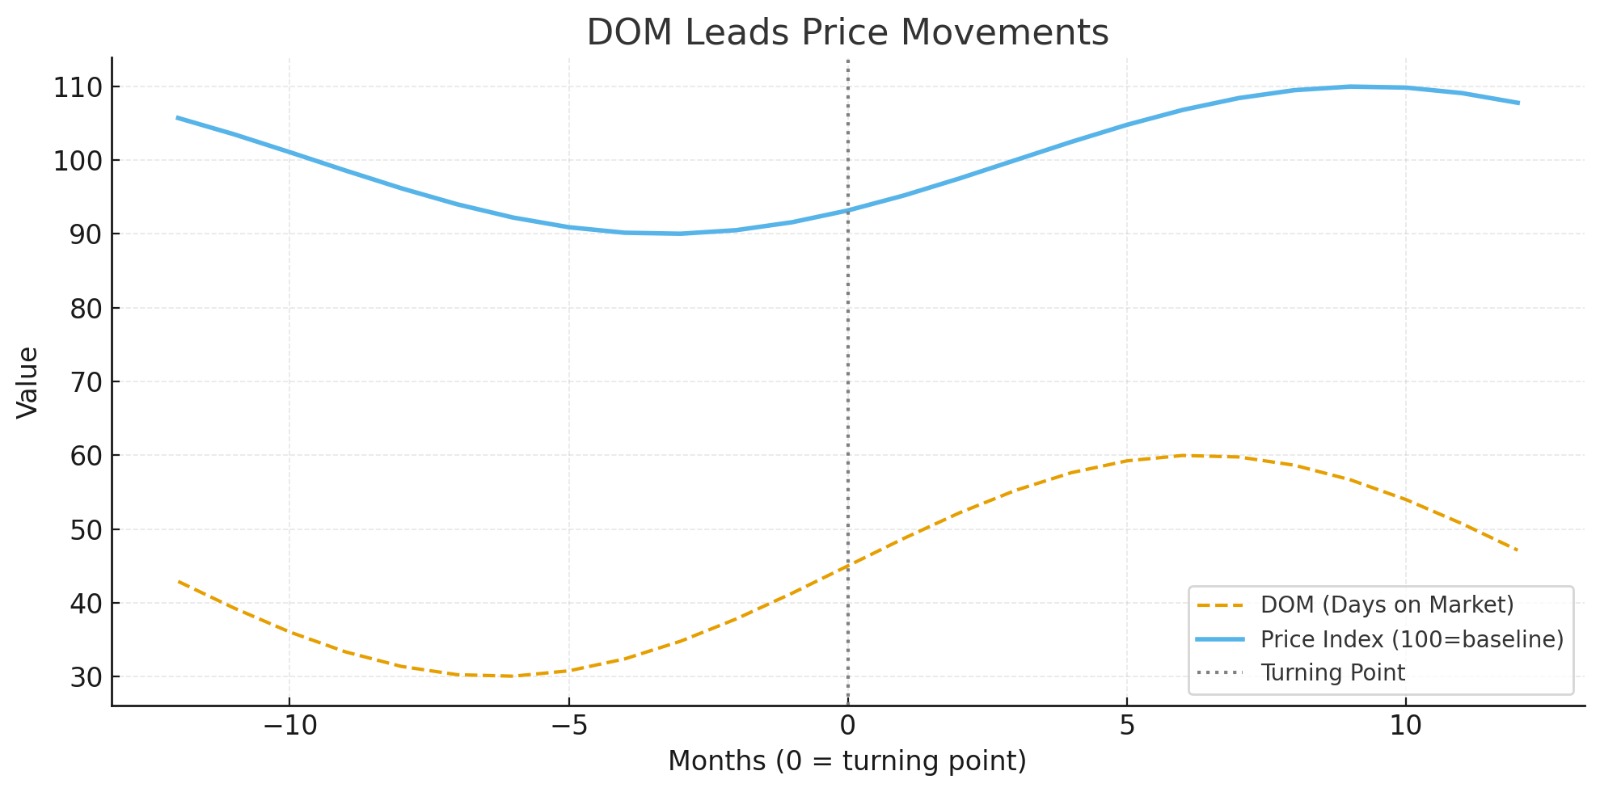
In other words, DOM is like a market thermometer — it warms up before prices climb and cools down before prices fall.
The Chain Reaction: DOM → Listing Prices → Transaction Prices
DOM moves before price changes appear in the data. The dynamics work like this:
-
DOM Changes – either compresses (heating market) or stretches (cooling market)
-
Listing Price Behavior Follows – sellers raise asking prices in hot markets, cut them in slow markets
-
Transaction Prices React Last – official deal data eventually reflects the new reality
This chain reaction makes DOM the earliest and most actionable signal for investors.
DOM in a Rising Market
When DOM compresses (listings sell faster):
-
Buyers compete → multiple offers become common
-
Sellers gain confidence → asking prices rise
-
Developers shorten payment plans or reduce incentives
This is why falling DOM often precedes a period of price growth.
DOM in a Cooling Market
In a slowing market, developers often respond with incentives — relaxed payment plans, higher commissions to agents, and even post‑handover payment schedules — as they try to maintain absorption levels.
When DOM stretches (listings stay longer):
-
Buyers negotiate harder → low-ball offers increase
-
Sellers offer discounts or flexible terms
-
Eventually, median listing prices start to drift lower
Only later do official transaction prices reflect the drop — which is why relying solely on sales data makes you late to react.
Why DXBinteract Treats DOM as a Core Metric
Currently, there is no official public dataset in Dubai to calculate DOM precisely. At DXBinteract, we are actively building a DOM analysis feature based on real transaction timelines and listing data.
At DXBinteract, DOM is one of the highest-weighted components in both our Market Heating Score and Market Cooling Score:
-
It reacts faster than sales volume or price indexes
-
It captures sentiment shifts in near real-time
-
It predicts both upturns and downturns effectively
By monitoring DOM by area, project, and property type, we can alert investors when markets are tightening or loosening — often weeks before prices follow.
Takeaway for Investors
If you want to stay ahead of the curve, watch DOM closely:
Remember: price changes are the result — DOM is the signal that gets you there first.
Register now for early access on DXBinteract.com to be notified when our DOM analysis feature goes live — and be the first to see real-time DOM trends.